The Challenges and Attractions of Private Equity Investing
LISTED PRIVATE EQUITY; PRIVATE EQUITY REIMAGINED
In Part 1 of our 4-part series Listed Private Equity: Private Equity Reimagined, Consulting Economist Steven Milch explores the challenges and attractions of private equity investing. Traditionally, private equity investing involved accepting restricted access to the invested capital and a general lack of transparency. In return, the data clearly shows that private equity has consistently outperformed shares – before and after allowing for risk – whilst also providing diversification benefits.
THE CHALLENGES OF PRIVATE EQUITY INVESTING
Whether classified as ‘venture capital’, ‘buyouts’, ‘secondaries’ or ‘co-investment’, private equity (or PE) investing is clearly different from share market investing. Compared to public equity – a largely passive form of company ownership – PE investing is characterised by the following challenges.
- long-term illiquidity, whereby PE investments often require a substantial minimum commitment that may be ‘locked up’ for 10 years or more,
- inflexible timing, as PE funds are often closed to investors and may remain uninvested for some time as they await underlying investment opportunities,
- lack of transparency, with PE managers having limited information on target companies and end-investors receiving infrequent valuations,
- the absence of clear price discovery, meaning that transaction pricing in private markets depends substantially on negotiations, and
- reduced separation between ownership and control which elevates the role of manager resources and expertise.
Given these challenges, two further characteristics are observed. First is the outperformance of private equity compared to public equity. Conceptually, this follows from PE investors requiring compensation for accepting the complexities of PE. Second is the ability for skilled private equity managers to clearly and consistently distinguish themselves through superior performance. We return to this in Part 3 of our series.
Private Equity’s superior performance
Looking at returns, the outperformance of private equity versus global shares is widely acknowledged. In the literature, authors such as Harris et al[1] describe the robust nature of this result.
Less well known is that the outperformance of PE has been achieved with lower risk or volatility than shares[2]. This is an important result as higher investment returns are usually accompanied by higher risk. Where higher returns are accompanied by lower risk, as in the case of private equity, that asset class becomes compelling.
CHART 1: SUPERIOR RISK-ADJUSTED RETURNS
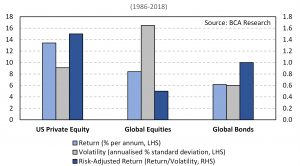
Chart 1 illustrates the higher returns and lower risk of private equity compared to global equities. Moreover, by displaying the ratio of return to risk, the chart shows the superiority of risk-adjusted PE returns relative to both shares and bonds. Interestingly, the chart also shows the superiority of bonds over equities – an observation we return to in Part 4 of our series.
A more consistent return comparison
Comparing the performance of PE to share market index returns could be misleading, however, due to the uncertain and variable timing of cashflows that is characteristic of private equity investments. To create a more valid comparison, one technique[3] is the calculation of a ‘Public Market Equivalent ‘(PME) equity return series that replicates private equity cashflows in a share market index.
Using this more rigorous PME approach, Chart 2 shows a performance comparison between US PE and US equities. Over time horizons from 3 years to 20 years, PE returns are again superior – with an average outperformance, or premium, of close to 3% per annum.
CHART 2: SUPERIOR LONG-TERM RETURNS

This magnitude of outperformance is consistent with that reported in the literature. Harris et al[4] refer to long term PE outperformance of “at least 3% per year” while JP Morgan identify a 15-year PE premium of 2.6% per annum[5].
Diversification and correlation
A final observation in relation to private equity relates to its diversification characteristics which we can measure by means of ‘correlation’.
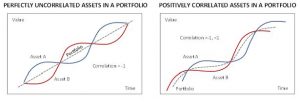
From an investment perspective, correlation indicates how one security moves relative to another. Assets that are synchronised in their movements are described as perfectly correlated and have a correlation of +1. Conversely, when two securities move in opposite directions, they are perfectly negatively correlated, with a correlation of -1.
Combining negatively correlated assets can reduce portfolio risk considerably without impacting return. This is illustrated via the stylised example in the LH panel of Chart 3. In practice, such a degree of diversification is difficult to achieve. More common are the diversification benefits gained by combining assets with correlations of less than 1, as per the RH panel of Chart 3. Here, while the portfolio value still exhibits fluctuations, the volatility has been reduced. This is the case with private equity, where we observe a correlation with global shares of 0.8[6].
CHART 3: PORTFOLIO DIVERSIFICATION AND CORRELATION
To conclude, we summarise the key conclusions in relation to private equity performance:
- private equity has consistently outperformed shares while exhibiting lower risk, thereby providing superior risk adjusted returns, and
- private equity provides portfolio diversification benefits, being less than perfectly correlated to equities.
In Part 2 of our series Listed Private Equity – A Superior PE Investment we discuss the emergence of listed private equity as a means by which private equity assets can be accessed via publicly traded securities.
REFERENCES
Bain & Company, “Global Private Equity Report”, 2020.
BCA Research, “Private Equity: Have We Reached The Top?“, 2018.
Bergmann, B., Christophers, H., Huss, M. and Zimmerman, H., “Listed Private Equity“ in Cumming, D.J. ed, Private Equity: Fund Types, Risk, Return and Regulation, 2010, Chapter 4, pp. 53-70.
Cambridge Associates, “US Private Equity (Legacy Definition) – Index and Selected Benchmark Statistics”, March 2020, <https://www.cambridgeassociates.com/wp-content/uploads/2020/07/WEB-2020-Q1-USPE-legacy-Benchmark-Book.pdf>.
Harris, R.S, Jenkinson, T. and Kaplan, S.N., “Private Equity Performance: What Do We Know?”, The Journal of Finance, 2014, pp.1851-1881.
J.P. Morgan Asset Management, “Long-Term Capital Market Assumptions”, 2020.
Kinlaw, W., Kritzman, M. and Mao, J., “The Components of Private Equity Performance: Implications for Portfolio Choice”, The Journal of Alternative Investments, 2015, pp. 25-38
ABOUT THE AUTHOR
Steven Milch
With a career as an economist and institutional investor spanning over 30 years Steven Milch (M Ec, B Comm Hons) has accumulated extensive financial market experience and a unique breadth of knowledge.
Steven currently holds postgraduate teaching positions with the University of New South Wales and Kaplan Business School. He manages assets in the not-for-profit sector and acts as Pengana Capital’s Consulting Economist.
Previously, Steven was Chief Economist and Head of Investments for the Suncorp Group. In this capacity, he led the Group’s Investment Research and Economics function and supervised the management of $21 billion of investment portfolios, focussing on asset allocation, manager selection and responsible investment initiatives.
Before joining Suncorp, Steven held the position of Chief Economist, St.George Bank. Steven has also worked at the Reserve Bank of Australia and has owned a successful investment advisory business. Steven is an investor in the Pengana Private Equity Trust (ARSN 630 923 643) (“PE1”).
IMPORTANT INFORMATION
Pengana Investment Management Limited (ABN 69 063 081 612, AFSL 219 462) (“Pengana”) is the issuer of units in PE1. A Product Disclosure Statement for PE1 (“PDS”) is available and can be obtained by contacting Pengana on (02) 8524 9900 or from www.pengana.com. A person who is considering investing in PE1 should obtain a copy of the PDS and should consider the PDS carefully and consult with their financial adviser to determine whether PE1 is appropriate for them before deciding whether to invest in, or to continue to hold, units in PE1. This report was prepared by Pengana and does not contain any investment recommendation or investment advice. None of Pengana, Grosvenor Capital Management, L.P., nor any of their related entities, directors, partners or officers guarantees the performance of, or the repayment of capital, or income invested in PE1. An investment in PE1 is subject to investment risk including a possible delay in repayment and loss of income and principal invested. Past performance is not a reliable indicator of future performance, the value of investments can go up and down.
[1] Harris, Jenkinson and Kaplan (2014) p.1880.
[2] Kinlaw, Kritzman and Mao (2015) p.30 table the standard deviation of US equities at 18% versus 12% for private equity, over the period 1996-2014.
[3] As per Bain & Company (2020), Cambridge Associates (2020) and Bergmann, Christophers, Huss and Zimmerman (2010).
[4] Harris, Jenkinson and Kaplan (2014) p.1880.
[5] J.P. Morgan Asset Management (2020) p.75.
[6] J.P. Morgan Asset Management (2020) p.105.